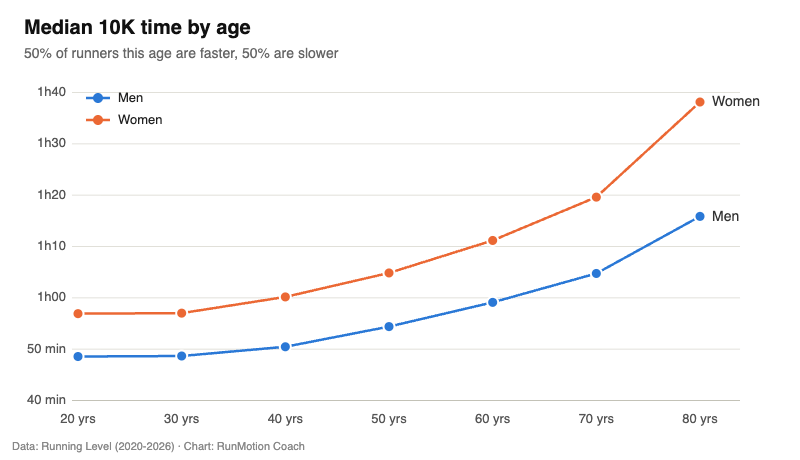
Your average 10K time depends a lot on your age and sex. Among runners who track their times, a 30-year-old man covers the distance in about 48′30″ (median time), compared with 54′ at 50 and 1h05 at 70. For women, it goes from 57′ at 30 to 1h05 at 50 and 1h20 at 70. Here is all the data, age group by age group, so you can see where your time stands, plus the 10K world records in every category.
The short answer
- Median 10K time among regular runners: 48′28″ for men and 56′14″ for women, all ages combined.
- Across all race participants, the average is slower: around 58′30″ for men and 1h09′40″ for women.
- Times barely change between 20 and 30, slip a little up to 40, then slow by roughly 8 to 12% per decade up to 70.
- A 50′00″ at 30 is “worth” about 56′16″ at 50 and 1h07′42″ at 70 for men, according to the standard age-grading tables.
- World records: 26′31″ for men (Yomif Kejelcha) and 28′46″ for women (Agnes Ngetich).
Contents
- Average 10K time: which numbers are we talking about?
- 10K times by age for men
- 10K times by age for women
- At what age do you start slowing down over 10K?
- How your time compares with a 30-year-old’s
- 10K world records: open category
- 10K world records by age group
- How to get faster over 10K at any age
- FAQ
- Sources
Average 10K time: which numbers are we talking about?
Before you compare your time, you need to know where the numbers come from. There are two main types of data, and they don’t tell quite the same story.
The first covers every race finisher. RunRepeat’s “The State of Running” study, based on 107.9 million results from more than 70,000 races between 1986 and 2018, gives an average 10K pace of 5′51″/km for men and 6′58″/km for women. Converted into finish times, that’s about 58′30″ for men and 1h09′40″ for women. This is the true “average runner”: the field includes plenty of first-timers, people running with friends and runners who aren’t chasing a time.
The second covers runners who log their times on specialist websites. Running Level, for example, analyses 45,801 10K results (35,344 men, 10,457 women) entered between 2020 and 2026. These runners are more consistent and faster than average: their median time is 48′28″ for men and 56′14″ for women. The big advantage of this data is that it’s broken down by age and ability, so it’s what we use in the tables below.
A quick word on terminology: people often talk about “average time”, but the median time is more meaningful. It’s the time that splits the field in two: half the runners are faster, half are slower. The average, on the other hand, is dragged up by walkers and very slow finish times.
If you’re preparing for your very first 10K, our article What goal time should you aim for in your first 10K? will help you set a realistic target.
10K times by age for men
The table below gives three benchmarks for each age: the median time (50% of runners are faster), the time that puts you in the fastest 20%, and the time that puts you in the fastest 5%.
| Age | Median time | Top 20% | Top 5% |
|---|---|---|---|
| 20 | 48′28″ | 42′05″ | 37′00″ |
| 30 | 48′34″ | 42′10″ | 37′05″ |
| 40 | 50′22″ | 43′44″ | 38′27″ |
| 50 | 54′18″ | 47′09″ | 41′27″ |
| 60 | 59′01″ | 51′15″ | 45′04″ |
| 70 | 1h04′39″ | 56′08″ | 49′21″ |
| 80 | 1h15′46″ | 1h05′47″ | 57′50″ |
Source: Running Level, 35,344 men’s 10K results (2020-2026).
In practice, if you’re 50 and run a 47′ 10K, you’re in the fastest 20% of your age group. The same time at 30 would put you just above the median.
10K times by age for women
| Age | Median time | Top 20% | Top 5% |
|---|---|---|---|
| 20 | 56′49″ | 49′35″ | 43′53″ |
| 30 | 56′55″ | 49′40″ | 43′57″ |
| 40 | 1h00′05″ | 52′26″ | 46′24″ |
| 50 | 1h04′45″ | 56′29″ | 50′00″ |
| 60 | 1h11′05″ | 1h02′01″ | 54′54″ |
| 70 | 1h19′31″ | 1h09′23″ | 1h01′25″ |
| 80 | 1h38′03″ | 1h25′33″ | 1h15′43″ |
Source: Running Level, 10,457 women’s 10K results (2020-2026).
So a 50-year-old woman who breaks the hour for 10K is comfortably above the median for her category. Going under 50′ puts her in the fastest 5%.
At what age do you start slowing down over 10K?
Good news: between 20 and 30, the median time barely moves (a 6-second difference for men). Between 30 and 40, the drop is still modest: under 2′ for men (+3.7%) and about 3′ for women (+5.6%).
It’s after 40 that the curve gets steeper, and it steepens further with each decade:
| Period | Men | Women |
|---|---|---|
| From 40 to 50 | +3′56″ (+7.8%) | +4′40″ (+7.8%) |
| From 50 to 60 | +4′43″ (+8.7%) | +6′20″ (+9.8%) |
| From 60 to 70 | +5′38″ (+9.5%) | +8′26″ (+11.9%) |
| From 70 to 80 | +11′07″ (+17.2%) | +18′32″ (+23.3%) |
RunMotion calculation based on Running Level median times.
These gaps are population averages, not your personal destiny. They blend the effects of ageing (declining VO2max, muscle mass and tendon stiffness) with lifestyle effects: people often train less at 55 than at 35. A large German study of around 900,000 half marathon and marathon results actually found that 25% of runners aged 65 to 69 were faster than half of runners aged 20 to 54 (Leyk et al., 2010). Training often matters more than your date of birth.
To understand how maximal oxygen uptake declines with age, read our article on how to calculate your VO2max.
How your time compares with a 30-year-old’s
To compare runners of different ages, athletics federations use age grading. The road running reference tables, updated in 2025 by Alan Jones and adopted by USA Track & Field, assign a factor to each age. Divide a reference time by that factor and you get the equivalent time at a given age.
The following table shows, for men, what a time run at 30 is “worth” at 40, 50, 60 and 70:
| Time at 30 | Equivalent at 40 | at 50 | at 60 | at 70 |
|---|---|---|---|---|
| 40′00″ | 41′31″ | 45′01″ | 49′10″ | 54′09″ |
| 50′00″ | 51′53″ | 56′16″ | 1h01′27″ | 1h07′42″ |
| 1h00′00″ | 1h02′16″ | 1h07′31″ | 1h13′45″ | 1h21′14″ |
And for women:
| Time at 30 | Equivalent at 40 | at 50 | at 60 | at 70 |
|---|---|---|---|---|
| 40′00″ | 41′34″ | 45′20″ | 51′06″ | 58′32″ |
| 50′00″ | 51′58″ | 56′41″ | 1h03′52″ | 1h13′10″ |
| 1h00′00″ | 1h02′21″ | 1h08′01″ | 1h16′39″ | 1h27′48″ |
RunMotion calculation based on the 2025 road age-grading tables (Alan Jones), 10K factors.
In other words, a 60-year-old man who runs 49′10″ is producing a performance equivalent to 40′00″ at 30. That puts things in perspective.
If you’d rather know your current potential than an average, the 10K, half marathon and marathon time predictor estimates your times from one or two recent races.
Want to get faster over 10K, whatever your age? RunMotion Coach builds a plan that adapts to your level, your schedule and your recovery. Try the app free for 7 days.
10K world records: open category
On the road, the open 10K world records are as follows:
| Time | Athlete | Race | |
|---|---|---|---|
| Men | 26′31″ | Yomif Kejelcha (Ethiopia) | Castellón, 16 February 2025 |
| Women (mixed race) | 28′46″ | Agnes Ngetich (Kenya) | Valencia, 14 January 2024 |
| Women (women-only race) | 29′27″ | Agnes Ngetich (Kenya) | Herzogenaurach, 26 April 2025 |
Kejelcha’s record was ratified in June 2026, after Rhonex Kipruto’s 26′24″ was annulled for doping.
10K world records by age group
One important point: World Masters Athletics, the world governing body for masters athletics, does not keep an official list of 10K road world records. The figures below are world bests by age group, compiled by road running statisticians. Categories go in 5-year bands: M50 means men aged 50 to 54, W50 women of the same age.
Men
| Category | Time | Athlete (age) | Race |
|---|---|---|---|
| M35 | 27′11″ | Amos Bett, Kenya (36) | Lille, 2022 |
| M40 | 27′48″ | Bernard Lagat, United States (40) | Manchester, 2015 |
| M45 | 29′28″¹ | Kenneth Mungara, Kenya (49) | Toruń, 2023 |
| M50 | 30′04″ | Juan Antonio Cuadrillero, Spain (50) | Laredo, 2021 |
| M55 | 31′40″ | Martín Fiz, Spain (55) | Valencia, 2019 |
| M60 | 32′34″ | Joël Rondole, France (61) | Troyes, 2026 |
| M65 | 34′04″ | Alastair Walker, United Kingdom (66) | Grangemouth, 2023 |
| M70 | 37′05″¹ | Alan Davies, United Kingdom (72) | Swansea, 2024 |
| M75 | 39′31″ | Cees Stolwijk, Netherlands (75) | Utrecht, 2025 |
| M80 | 42′58″ | Ed Whitlock, Canada (80) | Toronto, 2011 |
| M85 | 48′57″ | Fokke Kramer, Germany (85) | Kaltenkirchen, 2023 |
| M90 | 1h04′37″¹ | Ian Winship, United Kingdom (90) | Cumbernauld, 2026 |
¹ Time differs between sources.
Women
| Category | Time | Athlete (age) | Race |
|---|---|---|---|
| W35 | 30′41″ | Mary Keitany, Kenya (35) | Cape Elizabeth, 2017 |
| W40 | 32′23″¹ | Christelle Daunay, France (40) | Arras, 2015 |
| W45 | 32′29″ | Sinead Diver, Australia (45) | Burnie, 2022 |
| W50 | 34′14″ | Linda Somers, United States (50) | Paso Robles, 2011 |
| W55 | 35′54″¹ | Karima Harris, United Kingdom (56) | Chichester, 2026 |
| W60 | 36′43″ | Silke Schmidt, Germany (60) | Utrecht, 2019 |
| W65 | 38′37″ | Rosa Mota, Portugal (66) | Lisbon, 2024 |
| W70 | 43′20″ | Nora Cary, United States (70) | Dedham, 2025 |
| W75 | 44′33″ | Sarah Roberts, United Kingdom (75) | Letchworth, 2024 |
| W80 | 52′45″ | Jan Holmquist, United States (80) | Dedham, 2025 |
| W85 | 59′51″ | Deidre Larkin, South Africa (85) | Benoni, 2017 |
¹ Time differs between sources.
One performance stands out: Joël Rondole holds the M60 world best in 32′34″, a pace of 3′15″/km at over 60 years old.
How to get faster over 10K at any age
The numbers show a trend, not a limit. After 40 or 50, three things make most of the difference.
First, keep some intensity. As you get older, it’s tempting to only run easy. But interval sessions are what maintain your maximal aerobic speed (MAS), the quality that declines fastest. One or two well-dosed fast sessions a week are enough.
Next, strengthen your legs. Loss of muscle mass and strength explains a good part of the slowdown. Two short strength sessions a week (squats, lunges, calf raises, core work) protect your tendons and your stride.
Finally, respect recovery. At 55, you often need an extra day to absorb a hard session compared with 30. A plan that balances the load well beats a packed plan.
To structure all of this, a personalised 10K training plan adapts paces and volume to your actual level, not to an average. And if you’re coming back after a long break or feel any unusual pain, check in with a doctor first.
FAQ
What is a good 10K time at 50?
For men aged 50, the median time is 54′18″: going under 54′ puts you in the top half, under 47′ in the fastest 20%. For women aged 50, the median is 1h04′45″, and the top 20% starts at 56′29″.
What is the average 10K time for a beginner?
The best benchmark is the average across all race participants, beginners included: about 58′30″ for men and 1h09′40″ for women. Your own time will depend on your age, your sporting background and your preparation.
Is running 10K in 1 hour good?
Yes. A 1h00 10K works out at 6′00″/km. That’s a bit slower than the median for 30-year-old men (48′34″), but faster than the median for women from 40 onwards and for men from 70 onwards.
At what age do you run your fastest 10K?
Among amateurs, times are best between roughly 20 and 35, with very little difference across that period. A study of 312,342 Stockholm marathoners puts the average performance peak at around 34 (Lehto, 2016).
Can you still improve your 10K as you get older?
Yes, as long as you adapt your training: keep some fast sessions, do strength work and take care of your recovery.
Sources
- Wikipedia, list of masters world records in road running: https://en.wikipedia.org/wiki/List_of_masters_world_records_in_road_running
- World Athletics, ratification of Yomif Kejelcha’s 10K world record: https://worldathletics.org/news/press-releases/ratified-world-records-hoey-kejelcha-yamanishi
- World Athletics, ratification of Agnes Ngetich’s 10K world record: https://worldathletics.org/news/press-releases/world-records-ratified-duplantis-wanyonyi-ngetich-myers
Updated on 14 November 2026.
Whether you’re aiming for your first 10K or an age-group record, RunMotion Coach gives you a personalised plan that evolves with you. Start your 7-day free trial.